Performance
You can find/view information about our school data and performance from the School Performance Tables published by the Secretary of State on the Department of Education’s website by clicking the following link.
Letter from Nick Gibb – January 2020
2020 Results are not available as tests were not administered due to COVID-19.
Average progress scores in Reading, Writing and Maths
The average progress score is ranked across against 0.
Reading | Writing | Maths |
---|---|---|
+ 8.9 | + 3.9 | + 7.9 |
The data below is the 2019 data.
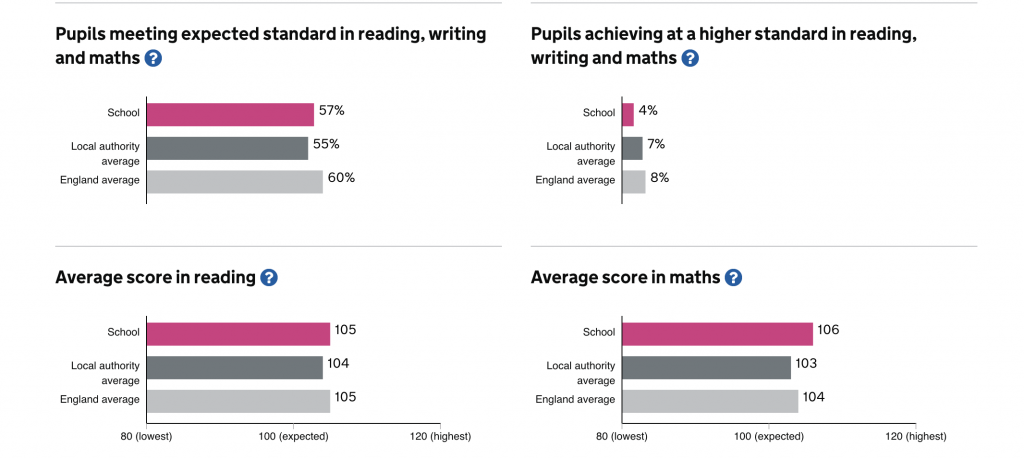
Average ‘scaled scores’ in Reading and Maths.
Reading | Maths | Grammar, Punctuation and Spelling |
---|---|---|
107 | 107 | 109 |
Percentage of pupils who achieved the expected standard or above in Reading, Writing and Maths.
Reading | Writing | Maths | Grammar, Punctuation and Spelling |
---|---|---|---|
76% | 64% | 80% | 76% |
Percentage of pupils who achieved a high level of attainment in Reading, Writing and Maths.
Reading | Writing | Maths | Grammar, Punctuation and Spelling |
---|---|---|---|
40% | 16% | 40% | 44% |
Percentage of pupils who achieved the expected standard in Reading, Writing and Maths combined.
64% |